Troubleshooting, Debugging, Profiling, and MonitoringTroubleshootingLoggingLogging is easy to control through the console, with commands grouped under log shell. To learn about the available logging commands type: karaf@root> log<tab> log:display log:display-exception log:get log:set karaf@root> Typical usage is: # Use log:set to dynamically change the global log level Worst Case ScenarioIf you end up with a Karaf in a really bad state (i.e. you can not boot it anymore) or you just want to revert to a clean state quickly, you can safely remove the data directory in the installation directory. This folder contains transient data and will be recreated if removed when you relaunch Karaf. DebuggingUsually, the easiest way to debug Karaf or any application deployed onto it is to use remote debugging. > bin/karaf debug
{noformat
or on Windows
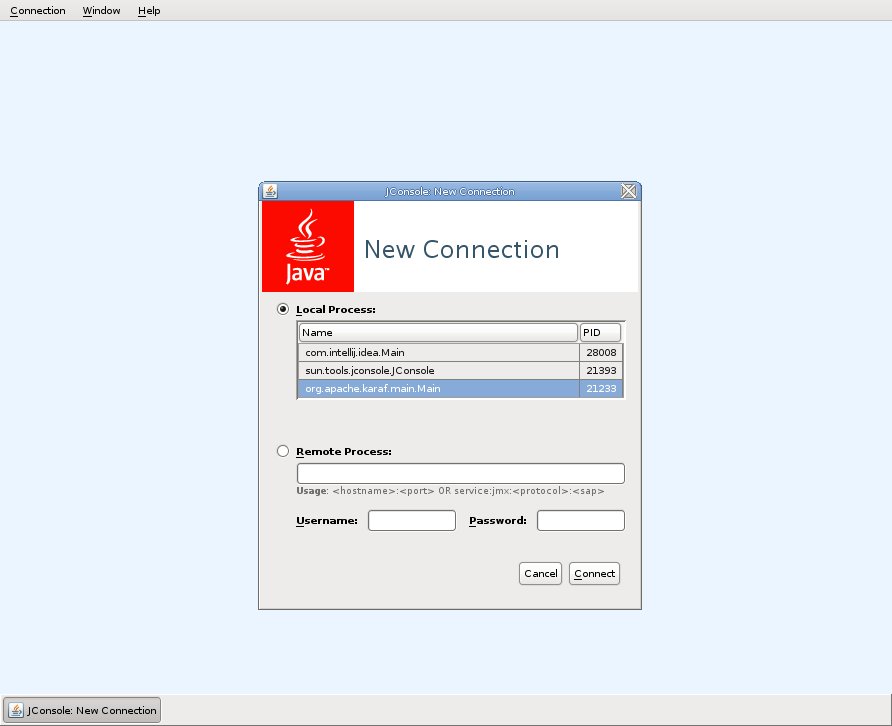
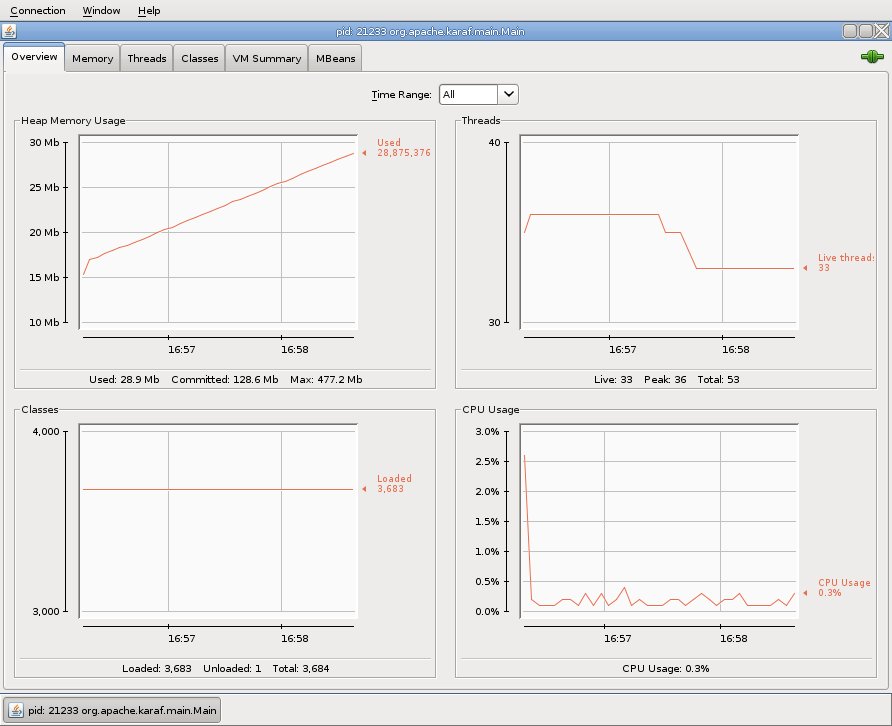
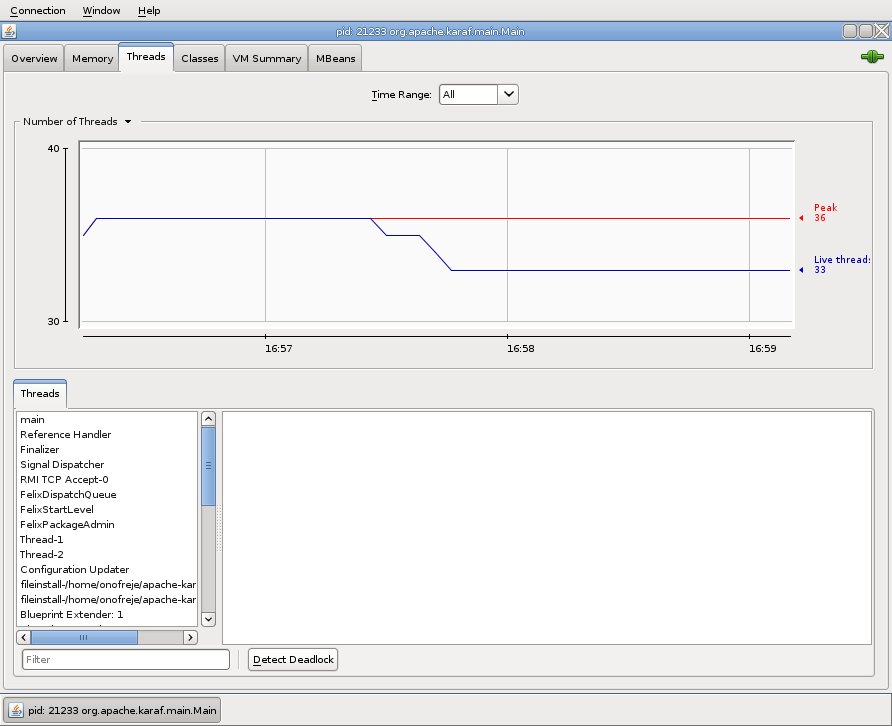
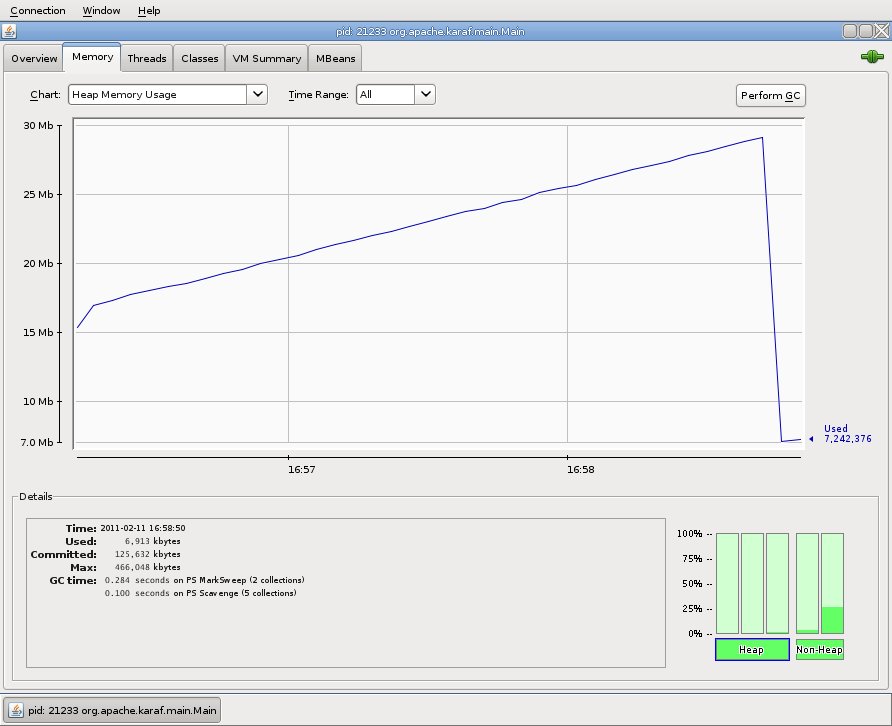
> bin\karaf.bat debug Another option is to set the KARAF_DEBUG environment variable to TRUE. This can be done using the following command on Unix systems: export KARAF_DEBUG=true On Windows, use the following command set KARAF_DEBUG=true Then, you can launch Karaf using the usual way: bin/karaf or bin\karaf.bat Last, inside your IDE, connect to the remote application (the default port to connect to is 5005). This option works fine when it is needed to debug a project deployed top of Apache Karaf. Nevertheless, you will be blocked export DEFAULT_JAVA_DEBUG_OPTS='-Xdebug -Xnoagent -Djava.compiler=NONE -Xrunjdwp:transport=dt_socket,server=y,suspend=y,address=5005' and on Windows, set DEFAULT_JAVA_DEBUG_OPTS='-Xdebug -Xnoagent -Djava.compiler=NONE -Xrunjdwp:transport=dt_socket,server=y,suspend=y,address=5005' ProfilingjVisualVMYou have to edit the etc/config.properties configuration file to add the jVisualVM package: org.osgi.framework.bootdelegation=...,org.netbeans.lib.profiler.server Run Karaf from the console, and you should now be able to connect using jVisualVM. YourKitYou need a few steps to be able to profile Karaf using YourKit. org.osgi.framework.bootdelegation=com.yourkit.* Then, set the JAVA_OPTS environment variable: export JAVA_OPTS='-Xmx512M -agentlib:yjpagent' or, on Windows set JAVA_OPTS='-Xmx512M -agentlib:yjpagent' Run Karaf from the console, and you should now be able to connect using YourKit standalone or from your favorite IDE. MonitoringKaraf uses JMX for monitoring and management of all Karaf components. The JMX connection could be:
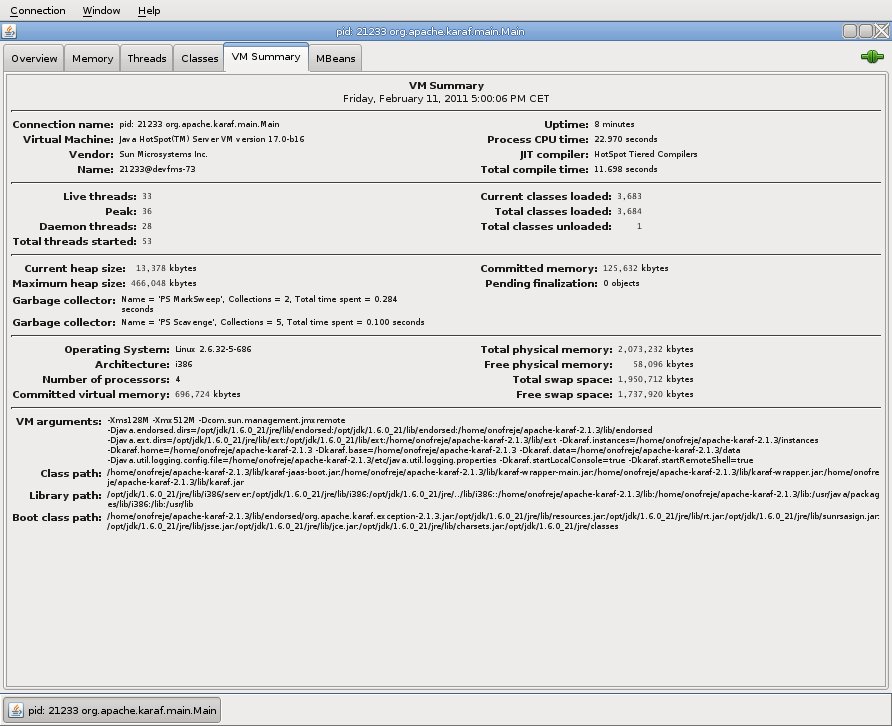
Using JMX, you can have a clean overview of the running Karaf instance:
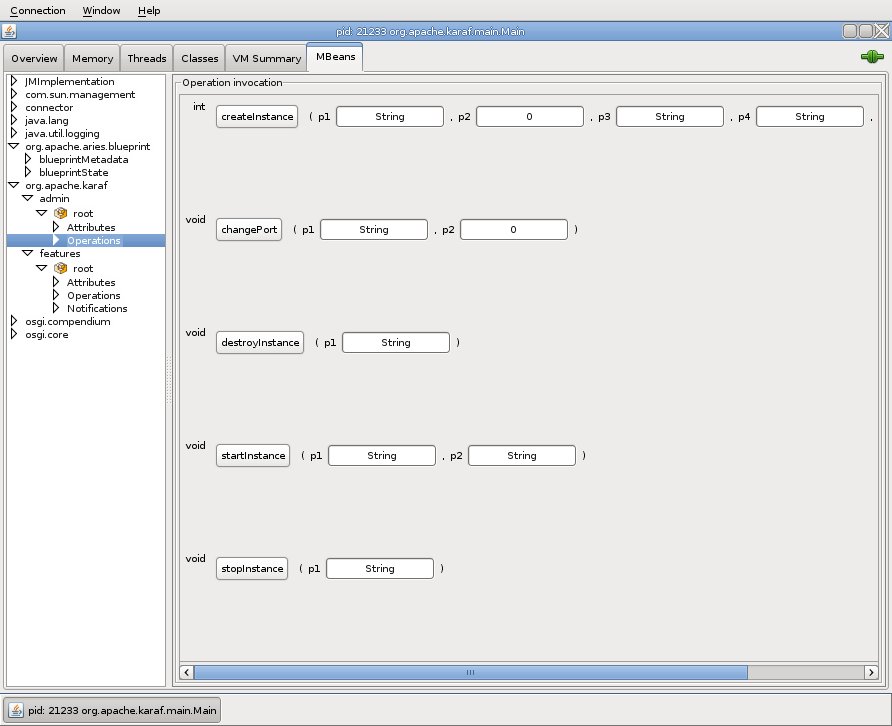
You can manage Karaf features like you are in the shell. For example, you have access to the Admin service MBean, allowing you to create, rename, destroy, change SSH port, etc. Karaf instances:
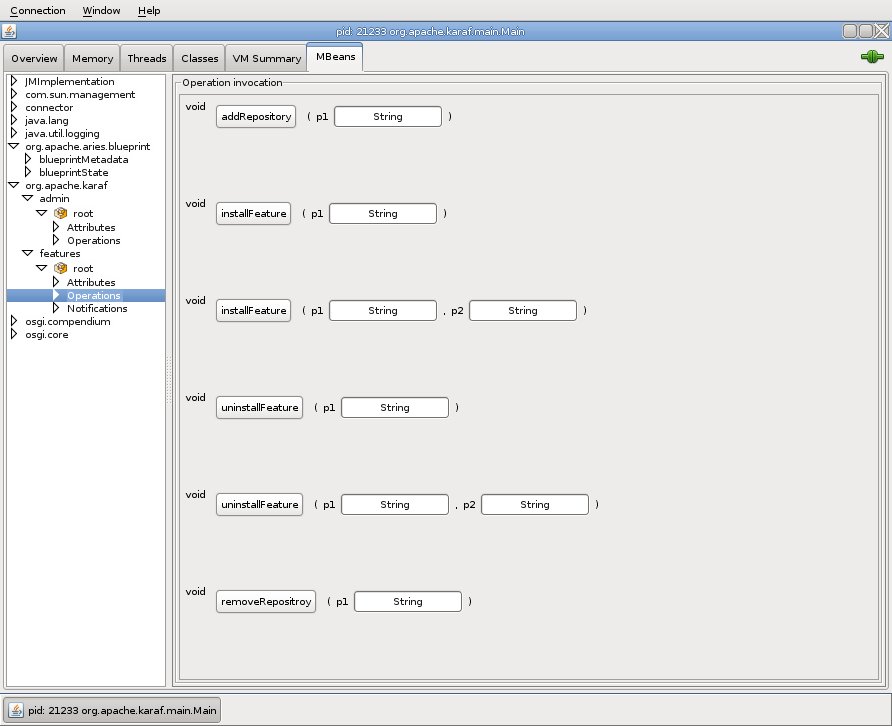
You can also manage Karaf features MBean to list, install, and uninstall Karaf features:
|


